The Ichimoku Kinko Hyo, or simply Ichimoku Chart, has its roots in Japan and is a versatile trading indicator used to gauge momentum, identify trends, and define support and resistance levels. Developed by Goichi Hosoda in the late 1960s, this powerful tool brings multiple indicators into one chart, providing a holistic view of the market. Despite its seemingly complex appearance, it offers traders a comprehensive yet straightforward method to study market trends. This article delves into the intricacies of the Ichimoku Chart, covering its components, interpretations, and applications.
What is Ichimoku Chart?
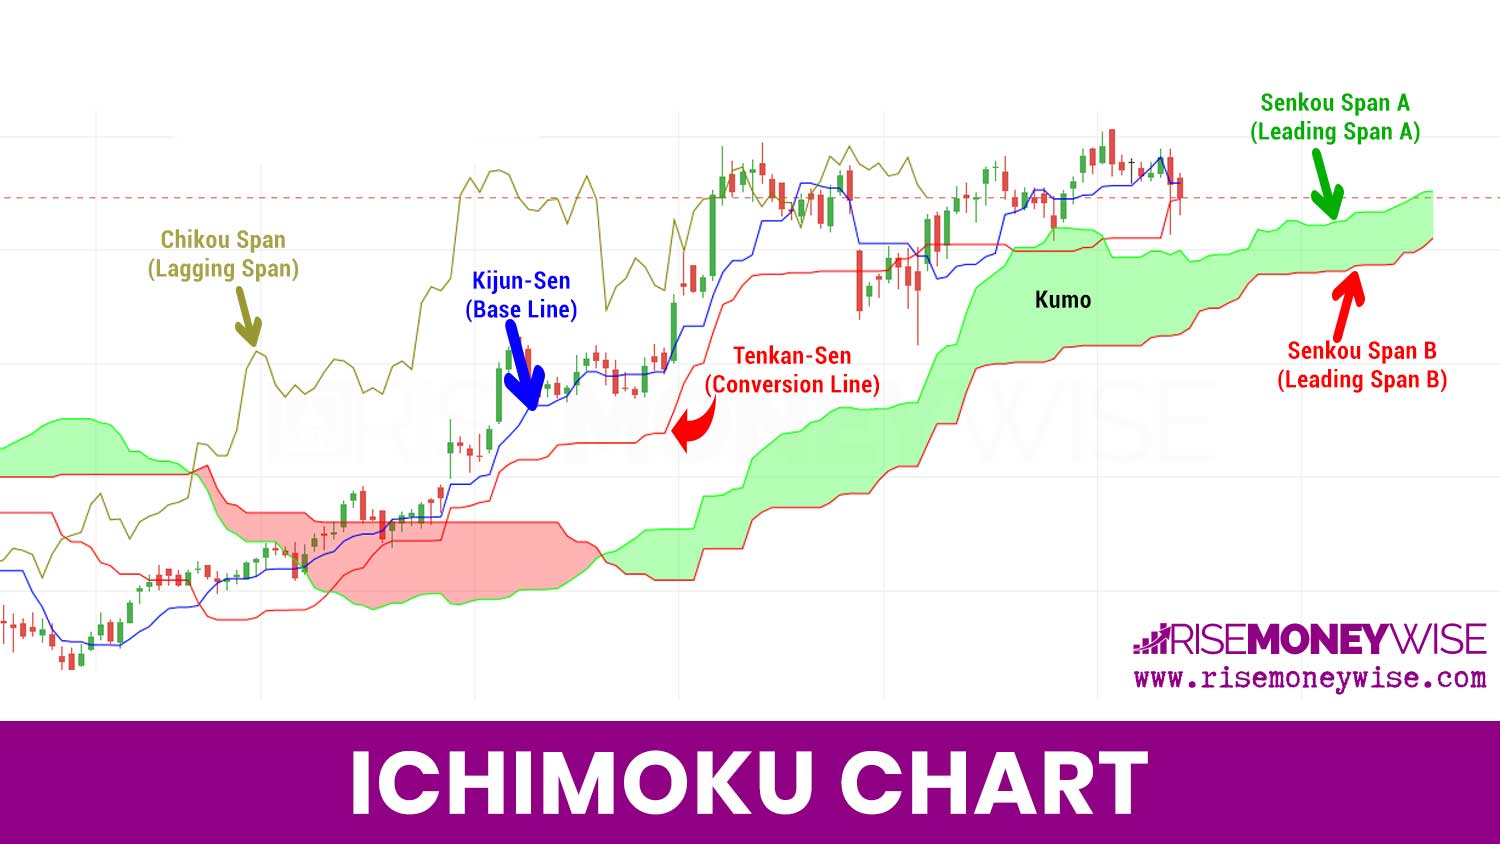
Ichimoku Kinko Hyo translates to “one look equilibrium chart,” reflecting the indicator’s ability to provide a comprehensive market assessment at a single glance. The Ichimoku chart consists of five main components: Tenkan-sen (Conversion Line), Kijun-sen (Base Line), Senkou Span A (Leading Span A), Senkou Span B (Leading Span B), and Chikou Span (Lagging Span). These five components work in synergy to provide a 360-degree view of the market.
Components of Ichimoku Chart
The Ichimoku Chart combines the following five components:
Tenkan-Sen (Conversion Line)
The Tenkan-Sen is calculated as the average of the highest high and the lowest low over a specific period, usually nine periods. This line is quicker to react to price changes and serves as a minor support or resistance indicator.
Kijun-Sen (Base Line)
The Kijun-Sen is akin to the Tenkan-Sen but covers a broader range, often 26 periods. It plays a significant role in generating trading signals and also acts as a support or resistance level.
Senkou Span A (Leading Span A)
This line is the midpoint between the Tenkan-Sen and Kijun-Sen and is plotted 26 periods ahead. It forms the upper boundary of the Kumo, or cloud, which is the space between Senkou Span A and Senkou Span B.
Senkou Span B (Leading Span B)
This is the average of the highest high and lowest low over typically 52 periods, plotted 26 periods into the future. It forms the lower boundary of the Kumo.
Chikou Span (Lagging Span)
The Chikou Span is the closing price plotted 26 periods behind and serves to confirm trends.
Interpretation of Ichimoku Chart
Trend Identification
The position of the price in relation to the Kumo helps in identifying the trend. If the price is above the Kumo, it indicates a bullish trend. If it’s below, the trend is bearish.
Support and Resistance
The Kumo cloud acts as an area of support and resistance. The Senkou Span A and Senkou Span B lines, which form the cloud, indicate these levels dynamically.
Momentum
The Tenkan-Sen and Kijun-Sen lines serve as momentum indicators. When the Tenkan-Sen crosses above the Kijun-Sen, it’s a bullish signal, and vice versa.
Confirming Signals
The Chikou Span can be used to confirm other signals on the chart. If it moves above the price, it’s a bullish sign, and if it moves below, it’s bearish.
Applications in Trading
Entry and Exit Points: Traders commonly use the Tenkan-Sen and Kijun-Sen crossover as an entry or exit point. A bullish crossover above the Kumo is a strong buy signal, while a bearish crossover below the Kumo indicates a strong sell.
Stop Losses: The Kumo can serve as a place to set stop-loss orders, providing a dynamic way to manage risk.
Timeframes: The Ichimoku chart is versatile and can be used in various timeframes, from intraday to long-term trading.
Challenges and Limitations
Complexity: For novice traders, the Ichimoku chart can seem overwhelming due to its multiple lines and interpretations.
False Signals: Like any trading tool, the Ichimoku chart is not foolproof and may occasionally produce false signals.
Cultural Biases: The Ichimoku was designed based on the Japanese trading environment, and some believe its effectiveness may vary in other markets.
Conclusion
The Ichimoku Chart stands out for its comprehensive nature, encapsulating trend direction, momentum, and support and resistance levels all in one glance. While it may appear daunting at first, understanding its components and their interactions can provide traders with a potent tool to navigate the complexities of the financial markets.
By offering multiple layers of analysis in a single chart, the Ichimoku significantly enhances decision-making, risk management, and the probability of trading success. Its versatile application across various timeframes and asset classes makes it an indispensable instrument in a trader’s toolkit.
However, like any other trading indicator, the Ichimoku chart has its limitations and should be used in conjunction with other tools and proper risk management strategies. Once mastered, it can serve as a reliable guide in the volatile journey of trading, offering insights that few other indicators can match.
Use the citation below to add this article to your bibliography
"Ichimoku Chart: A Powerful Trading Tool." Risemoneywise.com. Web. May 3, 2024. <https://risemoneywise.com/ichimoku-chart-a-powerful-trading-tool/>
Risemoneywise.com, "Ichimoku Chart: A Powerful Trading Tool." Accessed May 3, 2024. https://risemoneywise.com/ichimoku-chart-a-powerful-trading-tool/
"Ichimoku Chart: A Powerful Trading Tool." (n.d.). Risemoneywise.com. Retrieved May 3, 2024 from https://risemoneywise.com/ichimoku-chart-a-powerful-trading-tool/